Climate Change 101:
How Is the Global Climate Changing?
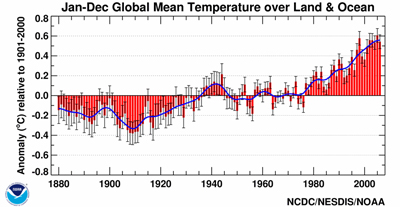
Recorded Global Temperature Changes
Global mean temperatures over land and ocean have increased over the past three decades as illustrated by the graphic.
- The global average surface temperature has risen between 1.08
°F and 1.26 °F since the start of the 20th century (NOAA, 2006). - The rate of increase since 1976 has been approximately three times faster than the century-scale trend (NCDC, 2008).
- Mean temperatures for the contiguous United States have risen at a rate near 0.6 °F per decade (NCDC, 2008).
- Six of the ten warmest years on record for the contiguous United States have occurred since 1998 (NCDC, 2008).
- Including 2007, seven of the eight warmest years on record globally have occurred since 2001 (NCDC, 2008).
- The 10 warmest years globally have all occurred since 1995 (NCDC, 2008).
References:
NCDC (National Climatic Data Center). 2008. Climate of 2007 – in Historical Perspective Annual Report. accessed August 31, 2009.
NOAA. 2006. NOAA Magazine. NOAA Reports 2006 Marked by Severe Heat Waves, Widespread Drought, Wildfires. December 14, 2006. www.noaanews.noaa.gov/stories2006 / s2759.htm, accessed August 31, 2009.
Graphic Reference:
NOAA - National Climatic Data Center - NOAA Environmental Satellite, Data, and Information Service. 2009. Climate of 2008 Annual Report - January 14, 2009. accessed August 31, 2009.