Ambient Concentrations of Ozone
![]() Exhibit 1. Ambient 8-hour ozone concentrations in the U.S., 1990-2021
Exhibit 1. Ambient 8-hour ozone concentrations in the U.S., 1990-2021
![]() Exhibit 2. Ambient 8-hour ozone concentrations above the level of the current NAAQS in the U.S., 1990-2021
Exhibit 2. Ambient 8-hour ozone concentrations above the level of the current NAAQS in the U.S., 1990-2021
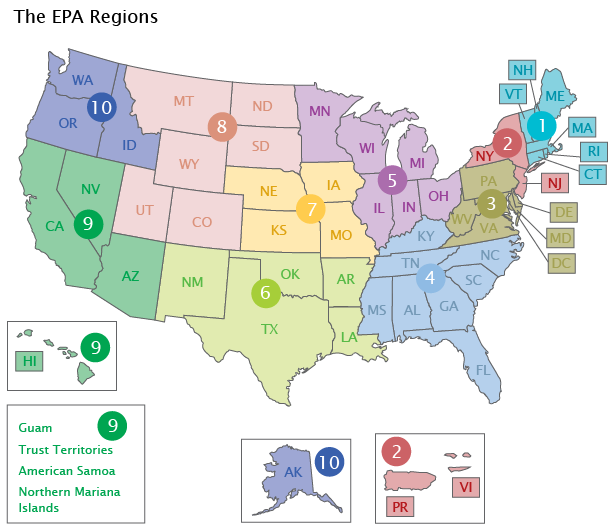
![]() Exhibit 3. Ambient 8-hour ozone concentrations in the contiguous U.S. by EPA Region, 1990-2021
Exhibit 3. Ambient 8-hour ozone concentrations in the contiguous U.S. by EPA Region, 1990-2021
Click the legend to turn layers on or off. Hover your mouse over the display to reveal data.
Hover your mouse over the display to reveal data.
Click the legend to turn layers on or off. Hover your mouse over the display to reveal data.
- Introduction
Ozone is a gas found in different parts of the atmosphere. Ozone in the upper atmosphere, or stratosphere, helps protect the Earth from the sun’s harmful rays. (The Stratospheric Ozone Levels indicator describes trends in stratospheric ozone levels over the U.S.) In the lowest level of the atmosphere, the troposphere, exposure to ozone also can be harmful to both human health and some plants. For this reason, ozone is often described as being “good up high and bad nearby” (U.S. EPA, 2003a). Most ground-level ozone forms in the air from chemical reactions involving nitrogen oxides (NOx), volatile organic compounds (VOCs), and sunlight. Ozone levels are typically highest during the afternoon hours of the summer months, when the influence of direct sunlight is the greatest. These highest levels occur during what is known as the “ozone season,” which includes at least the spring and summer months but whose time frame varies by state (U.S. EPA, 2003b).
Variations in weather conditions play an important role in determining ozone levels. Daily temperatures, relative humidity, and wind speed can affect ozone levels. In general, warm dry weather is more conducive to ozone formation than cool wet weather. Wind can affect both the location and concentration of ozone pollution. NOx and VOC emissions can travel hundreds of miles on air currents, forming ozone far from the original emissions sources. Ozone also can travel long distances, affecting areas far downwind. High winds tend to disperse pollutants and can dilute ozone concentrations. However, stagnant conditions or light winds allow pollution levels to build up and become more concentrated.
Inhalation exposure to ozone can cause many harmful health effects. The strongest evidence is for respiratory effects following short-term exposure to elevated ozone concentrations. These effects include lung function decrements, respiratory tract inflammation, and respiratory symptoms (e.g., difficulty breathing, coughing). Elevated short-term ozone exposure can also exacerbate asthma and chronic obstructive pulmonary disease (COPD) and has been associated with increased emergency room visits and hospital admissions for people with these conditions (U.S. EPA, 2020). Further, there is likely to be a causal relationship between elevated long-term ozone exposure and certain respiratory effects and between elevated short-term ozone exposure and certain metabolic effects (e.g., impaired glucose tolerance) (U.S. EPA, 2020). Suggestive evidence links both short-term and long-term ozone exposure to a range of other adverse health effects.
People most at risk from breathing air containing ozone include people with asthma, children, older adults, and people who are active outdoors, especially outdoor workers. In addition, people with certain genetic characteristics, and people with reduced intake of certain nutrients, such as vitamins C and E, are at greater risk from ozone exposure. Research also indicates people with certain health conditions, such as obesity or diabetes, may be at increased risk of ozone-related health effects. Elevated concentrations of ozone can also affect some vegetation and ecosystems (U.S. EPA, 2020).
Elevated concentrations of ozone can also affect some vegetation and ecosystems. Examples include visible foliar injury, reduced vegetation growth, reduced plant reproduction, reduced yield and quality of agricultural crops, reduced productivity in terrestrial ecosystems, alteration of belowground biogeochemical cycles, and alteration of terrestrial community composition (U.S. EPA, 2020).
This indicator presents ambient ground-level ozone concentrations in parts per million (ppm) from 1990 to 2021. Data are shown for 8-hour averaging times, based on continuous ozone monitoring data and consistent with this pollutant’s National Ambient Air Quality Standard (NAAQS). The 8-hour standard is indicative of exposures occurring over a sustained period of time (e.g., an outdoor worker’s exposure over the course of a work day). Trends for this indicator represent 496 sites in 355 counties nationwide that have data for the period of record in the State and Local Air Monitoring Stations network or by other special purpose monitors. The indicator also displays trends in ozone measurements in each EPA Region. This indicator’s exhibits display the corresponding NAAQS as a point of reference, but the fact that the national or regional concentrations fall below the standard does not mean that all monitoring sites nationally or in any EPA Region also are below the standard. The indicator displays trends in the number of the 496 sites nationwide at which ozone concentrations exceeded the 8-hour standard, but this statistic is not displayed for each EPA Region.
For the 8-hour trends in this report, the fourth highest daily maximum 8-hour concentration in each year is used to be consistent with the 8-hour ozone standard.
- What the Data Show
Between 1990 and 2021, nationwide fourth highest daily maximum 8-hour ambient ozone concentrations decreased by 21 percent (Exhibit 1). The 8-hour ozone level in 2021 ranks among the lowest over the past 32 years (Exhibit 1), and the number of trend sites measuring ozone concentrations above the level of the 8-hour NAAQS decreased by 73 percent over the time frame covered in this indicator (Exhibit 2). Among the ten EPA Regions, the most substantial declines in 8‑hour levels were observed in EPA Regions 1 and 2, which originally had some of the highest ozone concentrations (Exhibit 3). Over nearly the entire period of record, Region 10 showed the lowest Regional ozone levels.
Also shown in Exhibit 1 are the 90th and 10th percentiles based on the distribution of statistics at the monitoring sites. This provides additional graphical representation of the variability of measured concentrations across the monitoring sites. Thus, the graphic displays the concentration range where 80 percent of measured values occurred.
In summary, despite reductions in ambient concentrations of ozone over the past quarter century and decreases in the emissions of ozone precursors since 1990 (the Nitrogen Oxides Emissions indicator; the VOC Emissions indicator), ozone concentrations above the health-based air quality standards remain one of the most persistent air pollution problems in many parts of the U.S.
- Limitations
- Because most monitoring sites are located in urban areas, the trends might not accurately reflect conditions outside the immediate urban monitoring areas.
- Because of the relatively small number of trend sites in some EPA Regions, the regional trends are subject to greater uncertainty than the national trends. Some EPA Regions with low average concentrations may include areas with high local concentrations, and vice versa. In addition, the 496 trend sites in this indicator are not dispersed uniformly across all states in the EPA Regions. The 496 trend sites are located in 47 states. In the remaining 3 states, there currently are insufficient long-term data from the existing monitoring sites to include in this indicator.
- To ensure that long-term trends are based on a consistent set of monitoring sites, selection criteria were applied to identify the subset of ozone monitoring sites with sufficient data to assess trends since 1990. Monitoring sites without sufficient data are not included in the trend analysis. Some excluded monitoring sites reported ozone concentrations above the level of the ozone standard over the time frame covered by this indicator. In 2021, for example, 271 sites recorded ozone concentrations above the level of the NAAQS: this includes the 107 trend sites shown in Exhibit 2, and 164 sites that did not have sufficient long-term data to be included in this indicator.
- Data Sources
Summary data in this indicator were downloaded from EPA’s National Air Quality: Status and Trends of Key Air Pollutants website (U.S. EPA, 2022a) (https://www.epa.gov/air-trends). The summary data are based on ozone ambient air monitoring data in EPA’s Air Quality System. National and regional trends in this indicator are based on the subset of ozone monitoring stations that have sufficient data to assess trends since 1990.